Friday 1 May 2020

#114 April Money Update

Income & Spending


Apr '20
In
Gross Income
$7,047.88


Out
Total Tax and NI
$2,068.68
Total Variable Spending
$1,443.10
Total Fixed Spending
$1,794.59
Total Short Debt Repayment
$0.00


Pre Fixed Savings
Net Income pre Fixed Savings
$1,741.51
Savings Rate (%) pre Fixed Savings
25


Post Fixed Savings
Fixed Savings
$1,305
Net Monthly Cash
$437
Cash Savings Rate (%) Post Fixed Savings
6

Well, due to Covid we are spending a fair bit less. In fact this month we had the lowest 'variable' spend since I began tracking in that format over 2 years ago.


Wealth Building

Equities + Cash, excludes money we put aside for holidays (once the world returns to normal)  and so is my best indication of money we expect to have for some time. We're up to £15.3k which is £400 off of our best ever.. expecting to keep ploughing money into this to grow our wealth.

Equities - which is a split between Global Index tracker and my dividend based portfolio - increased to £5.8k. This is the most I have ever held in equities.


When including the holiday savings (£10.1k) and pension (£50.9k) we currently have wealth of £76.3k which is a) £5.9k higher than last month and b) the most we've ever had.


Wednesday 29 April 2020

#113 Portfolio Addition

With the addition of NXT last time round my portfolio has increased to 12 companies.

ABF - BATS - BNZL - BWY - CCH - DGE - JMAT - LGEN - MNDI - NXT - SSE - ULVR

After some shortlist reviewing today I am looking at Moneysupermarket.com (MONY).


Well known comparison and insurance site. Within a sector (Media) that I currently do not have exposure too.

With a current share price of 315p, currently sitting squarely in the middle of the 52 week high (419) and the 52 week low (210).

Market Cap of £1.7bn puts it in the top quarter of the FTSE250.


Dividends

Current potential yield is 3.72%
Continuous dividend increases for the last 10 years. Averaging 8% yoy growth over the last five years.
Div cover of 1.55 currently.

Financials
  1. Are Earnings Per Share (EPS) consistently growing? YOY EPS growth 5+ year
    1. Yes they've grown YOY for the last ten years. πŸ‘
  2. Are they paying out too much on dividends? Payout Ratio <60%
    1. The average payout ratio for the last 5 years is 69%. This is trending down though.
  3. Is the ratio of share price to earnings sufficiently low enough? PE ratio <18
    1. 16.81 πŸ‘
  4. Is the Gross and Net Operating profit high enough? Gross 20%> Net 5%>
    1. πŸ‘Gross average is above 70%, Net above 30%
  5. Debt levels? Current Ratio >1 & Debt:Equity <1
    1. 1.32 and 0.15 respectively πŸ‘
My only concern here is the payout ratio is above 60%, but it is trending down quite consistently and in 2019 was only 63%

What I've been looking for is a company that is consistently growing YOY and providing a good return via dividends. MONY tick all of those boxes.
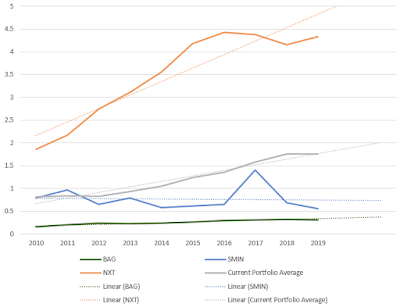
MONY EPS over the last 10 years vs the average of my portfolio...

So far I am convinced. The obvious concern is has the growth already happened.

The last check is vs the sector because 'Media' encompasses quite a few other candidates. From the FTSE100 we have

AUTO - too low yield for further analysis
INF - earnings performance isn't as strong
ITV - earnings performance isn't as strong
PSON - earnings performance isn't as strong
REL - too low yield for further analysis
RMV - I would really like to be invested in but the current yield is too low for my strategy ~1.3%
WPP - potentially but 10% yield raises flag

On that basis I am going to go with my instinct and add £200~ of MONY to my dividend portfolio, to take me up to 13 companies....

70 MONY shares purchased for £228.61 an average of £3.27 per share.
This equates to an expected yield per share of 3.59%
This increases the total forecast annual dividend of my portfolio to £90.17
MONY now makes up 9% of my portfolio weighted by holding value


Wednesday 15 April 2020

#112 Portfolio Addition

My long term strategy remains to invest in global index funds via my SIPP and ISA account.

In parallel, and mainly because I find it fun and therefore motivating I will continue investing additional funds into my Dividend producing portfolio.

The portfolio currently consists of 11 companies from the FTSE 350.

ABF - BATS - BNZL - BWY - CCH - DGE - JMAT - LGEN - MNDI - SSE - ULVR

I currently have a shortlist of 14 potential companies to add. I am aiming for a minimum of 15 companies within the portfolio before I consider increasing my investments in any of them.

The shortlist nominees are:

BAG - BRBY - CPG - CRDA - CWK - DCC - DPLM - HLMA - NXT - PRU - RB. - RMV - SMIN - SPX

However, based on current prices 6 are excluded because the yield is below 2.5%.

Excluded (6): CRDA - CWK - DPLM - HLMA - RMV - SPX

Remaining(8): BAG - BRBY - CPG - DCC - NXT - PRU - RB. - SMIN

Given I still have a relatively small portfolio I am also excluding companies which are within sectors where I currently own another company. I expect that in the future some of these may well be considered but for now they will be removed.

Excluded (4): CPG - DCC - PRU - RB.

Remaining (4): BAG - BRBY - NXT - SMIN

~~~~~~~~~~~~~~~~~~~~~~~

I reviewed SMIN in my previous #109 post and concluded that they were a possible but that the EPS lacked growth which was a cause for concern.

Let's see how BAG - BRBY and NXT weigh up.

Info:

BAG - the makers and providers of Scotlands famous Irn-Bru. £570m FTSE250
BRBY - luxury, fashion designer, manufacturer and retailer. £5.8bn Market cap. FTSE100
NXT - clothing retailer. Market Cap of £6.3bn. FTSE100 incumbent.

Dividends:

BAG - yield 3.3%, have 17 years of increasing dividends and a div cover of 1.92.
BRBY - yield 3.35, have 10 years of increasing dividends and a div cover of 1.95.
NXT - yield 3.55, have 1 year of increasing dividends and a div cover of 2.68. They were held previously but had many specials delcared which makes them slightly harder to compare.

Financials:

All three have either 3 (BRBY) or 4 (BAG & NXT) years EPS growth out of the last 5.
NXT has the lowest Payout Ratio (35%), followed by BAG (45%) and BRBY (55%)
All three have strong Operating margins.
NXT PE Ratio (9.17)  is almost half that of BRBY (15.02) and BAG (16.08)
re: Debt, NXT are the only one with a warning light, their Debt:Equity is 1.63 where I am usually looking for <1.

Conclusion:

I've just noticed that I missed that BRBY operate in the Personal Goods sector and thus I should really remove them... they looked a good option, so one for the future.

That leaves BAG, NXT and SMIN.


Given my concerns about SMIN EPS growth I mapped the previous 10 years for each potential and added the average of the 11 companies within my portfolio already.

It re-enforces that I will stay away from SMIN for the time being.

On this extended horizon it also paints NXT in a very positive light. If I was to use a 5 year horizon it would not look as strong growth.


I will however, on this time, side with NXT as my portfolio addition. They are a strong, consistent dividend payer, tick almost all of my screen requirements and on-top of that are a brand that I know and like very much - as does the wife.


Purchase Details


  • 5 NXT shares were purchased for a cost price including fees of £243.48, ave cost per share of £48.70.
  • NXT now form 10% of my portfolio by value.
  • This adds an expected £8.25 in expected annual income, taking the total forecast annual income to £86.61. This has dropped recently due to the dividend cuts to BNZL, BWY and MNDI.


Saturday 4 April 2020

#111 First Annual FI Review - April 2020

Whilst not targeting RE it's nice to track when we might be FI.

As is said "What gets measured, gets improved "

In 2018 I built a 'model' based on the below assumptions.

Workplace Pension value £31,800
Contributions of £10,800 per annum, with contributions growing 2% per annum

SIPP value £0
Contributions of £1200 per annum, with contributions growing 5% per annum

Other Equities (ISA etc) value £1,500
Contributions of £2,400 per annum, with contributions growing 2% per annum

Assumed annual growth for all of these is 5%

How have we progressed vs the forecast?


Value
Forecast
Actual

Apr-20
Apr-20
+/-
Workplace Pension
£45,000.00
£44,000.00
-£1,000.00
SIPP
£2,620.80
£1,900.00
-£720.80
Other Equities (Eg ISA)
£6,657.49
£4,100.00
-£2,557.49
*New* Cash
£0.00
£10,000.00
£10,000.00
Total
£54,278.29
£60,000.00
£5,721.71

My contributions into Workplace Pension, SIPP and Other Equities have not been as high as expected plus with the recent market turmoil the values have dropped.

With the addition of the Cash buffer though it's nice to see that I'm ahead of where I had forecast, even taking the turmoil into account.

How much do we need to be FI?

Our annual spend in 2019 minus Tax/NI and Mortgage was £36k

If we use the 4% draw-down rule that means we'll need a minimum 'pot' of £913k~

Other Changes...

I had previously forecast an annual growth rate of 3%. I think this was being too conservative. Generally, it seems the historical annual growth for the major indexes is anywhere between 7%  and 12%, and 10% in between.

However, I also did not take into account inflation which will erode the spending power of that pot.

The average annual inflation amount is roughly 2%. 2% is also the Bank of England's target.

Given that I need to understand how this can be modelled more accurately I'll simply use a lower level of expected growth to account for the erosion by inflation. Using the lower of the growth estimates minus inflation average = 5%, which I what I am now using for the model.

What does all this mean?

Updating with actuals plus increasing the expected growth to 5% has suggests we'll be FI in 2045, when I am 59.


As I said at the start "what gets measured, gets improved". So keeping an eye on this and using it for my annual targets and goals should stand me in good stead. My intention isn't to keep on top of this too regularly, an annual review and inclusion in annual goal setting should be enough.

I have also not included any mention of the state pension. I worry about the pension situation that looms in this country and am not relying on that in any shape or form.

The second significant assumption I should remind myself of, is that this assumes we are mortgage free. For today I'll leave that assumption as it is, but possibly one to review in the future.


Wednesday 1 April 2020

#110 March Money Update

March Income vs Spending


Mar '20
Gross Income
£21,960.67


Total Tax and NI
£8,271.00
Total Variable Spending
£2,360.85
Total Fixed Spending
£1,587.64
Total Short Debt Repayment
£0.00


Net Income pre Fixed Savings
£9,741.18
Savings Rate (%) pre Fixed Savings
44%


Fixed Savings / Investments
£1,102
Net Monthly Cash
£8,640
Cash Savings Rate (%) Post Fixed Savings
39%

Commentary:

Bonus month. 

I've spoken about what we will do with the excess cash previously, so won't dwell on that. But I will take another second to appreciate a) the income and b) the fact that we are short-term debt free and thus we can invest in wealth building rather than seeing this money go straight out.

Still £8,271 on tax is steep! I once listened to a podcast where a 'taxman' was explaining a hypothesis that if we all looked at tax as charity donations then it would give us a positive feeling upon reflection rather than a negative. I am therefore choosing to think of all the good work this tax will do, and think of it as a charitable donation to our society.

Obviously because of the bonus our savings rate, both pre and post our monthly fixed investments, was significantly higher than previously.


Variable spending was actually our lowest for six months. The second - and final for the year - month without council tax meant that our fixed spending was slightly lower than average too.

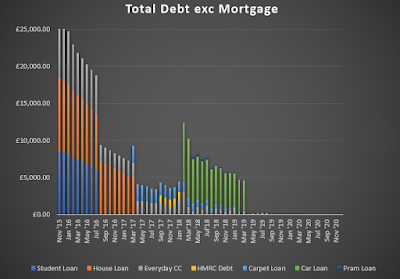
The result of not having to pay back any short-term loan as we have done in previous years is shown well in this graph... in 2017, 2018 and 2019 we made significant payments and in 2020 we didn't


March Wealth Update
  • £351.62 paid into workplace pension
  • £100 paid into SIPP
  • £500 paid into workplace sharesaves (current Share Price £72.88)
    • £100 into 2021 maturity (£100 for holiday) 
      • Option Price £57.87
    • £200 into 2022 maturity (£100 for holiday, £100 for savings)
      • Option Price £54.68
    • £200 into 2023 maturity (£100 for holiday, £100 for savings)
      • Option Price £59.56
  • £150 paid into kids JISAs for the first time - global index funds

Bonus money

  • £5k added to emergency cash pile
  • £1,400 into my Dividend portfolio - not all of this has been invested yet
  • £1,200 into my Global Index ISA - not all of this has been invested yet
I also found out I have been awarded some additional shares as part of a retain and incentive plan. This results in receiving, as long as I remain at the company;
  • 76 shares in October 2021
  • 76 shares in October 2022
These seem like a long way off, and a lot can happen in between then, both personally, my role and the share price. So I'm going to forget about these now until closer to the date. It is very rewarding to have been provided with my first incentive shares though.

Milestones
  • Short-term debt free for 8 months
  • Equities investments (outside of pension) now above £4k
  • Emergency cash amount is now £10k
  • Including house equity our Net Worth has increased above £220k
Should always enjoy this view as it took a lot of hard work and discipline to get to where we are now.
 Even though pension contracted a fair bit with the global crisis good to see this still moving forward
One of my old favourite graphs. Excluding Holiday Savings means we exclude money which is committed to being spent. So this is the money we have invested  or put aside that I expect to keep, 
 Always good to see the YOY growth of all money. Amazing to think that it's not actually been that long - about 4 years since I started tracking.
Very happy to see the first payments for the kids included here. 

They all have cash savings which are not expected to be added to an further. Now I'm investing £50 each into global index fund.

The oldest is about to turn 8 so that's at the very least a decade of compound growth and TIME in the market for my little angel.

Tuesday 31 March 2020

#109 Portfolio Purchase

I thought Brexit was the 'big' thing that we'd live through for a while... well Covid-19 certainly tops that doesn't it.

Dividends are being cut left, right and centre. However, I am going to plough on in the hope that the companies I invest in remain solvent and return to earnings and dividends growth in a few short years.

Tomorrow I will invest the next £200 from my bonus 'dividend portfolio' cash. A new purchase will follow every 2 weeks until that money has used.

Focus remains on building the size of the portfolio, in terms of quantity of companies, until I have a minimum of 15 (currently 10 - although 1 of those is significantly smaller and purchased prior to all of this. So 9 in reality).

I've got 9 stocks on my watch list.

AHT  / BRBY / CPG / DCC / MGGT / MNDI / PRU / RB. / SMIN

6 of these are ruled out at the moment as I own companies within their sectors already

AHT, CPG, DCC = same sector as BNZL
RB. = same sector as BWY
PRU = same sector as LGEN
BRBY = same sector as ULVR

Obviously, some of these have a higher degree of overlap than others. However, for simplicity sake, and whilst I have other options, I am putting them to one side.

That leaves MGGT, MNDI and SMIN

~~~~~~~~~~~~~~~~~~~~~

Meggit (MGGT). Aerospace and Defence sector, one where I hold no shares.

High performance engineering company supplying predominantly to aircrafts.

Obviously available (283p) at a massive discount to 52-week high (701p) with 196p the 52-low.

Market cap of £2.2bn means it's 98th on the FTSE100 rankings and a possible relegation looms.

Dividends

Potential yield at current price is 6%
Dividends paid since 2000 with 11 years of consecutive annual growth. Growing at over 4.9% per annum over the last 5 years.
Div Cover is a more than healthy 2.05

Financials:

I don't really know what I'm doing in this area. But lots of reading over the years has led me to focus on a couple of core things.
  1. Are Earnings Per Share (EPS) consistently growing? YOY EPS growth 5+ year
    1. Grown in 2 of the last 5 years. πŸ‘Ž
  2. Are they paying out too much on dividends? Payout Ratio <60%
    1. 56% πŸ‘
  3. Is the ratio of share price to earnings sufficiently low enough? PE ratio <18
    1. 7.21 πŸ‘ 
  4. Is the Gross and Net Operating profit high enough? Gross 20%> Net 5%>
    1. πŸ‘Gross average is above 40%, Net above 14%
  5. Debt levels? Current Ratio >1 & Debt:Equity <1
    1. 1.8 and 0.49 respectively πŸ‘

Conclusion:

A solid potential, ticking every box other than EPS growth. Perhaps the yield on offer would make this a worthwhile risk.

~~~~~~~~~~~~~~~~~~~~~
Mondi (MNDI). In Forestry and Paper sector, where I currently have no shares. To be honest I wasn't aware this was a sector.

Manage forest and produce pulp, paper and plastic films.

Current price is 1,383p
52-high 1,861 and 52-low, 1,156

Market Cap of £6.71bn, 50th~ in the FTSE100


Dividends

Potential yield at current price is 5.4%
Dividend paid since 2008, 11 years of consecutive dividend growth. Growing at over 13% per annum.
Div Cover is a more than healthy 2.06

Financials:

I don't really know what I'm doing in this area. But lots of reading over the years has led me to focus on a couple of core things.
  1. Are Earnings Per Share (EPS) consistently growing? YOY EPS growth 5+ year
    1. Grown in 4 of the last 5 years. πŸ‘
  2. Are they paying out too much on dividends? Payout Ratio <60%
    1. 40.8% πŸ‘
  3. Is the ratio of share price to earnings sufficiently low enough? PE ratio <18
    1. 8.78 πŸ‘ 
  4. Is the Gross and Net Operating profit high enough? Gross 20%> Net 5%>
    1. πŸ‘Gross average is above 43%, Net above 14%
  5. Debt levels? Current Ratio >1 & Debt:Equity <1
    1. 1.05 and 0.37 respectively πŸ‘

Conclusion:

Literally, MNDI tick every box on my screen and coupled with a 5.4% yield and a history of really impressing dividend growth, going to take something to beat this.

~~~~~~~~~~~~~~~~~~~~~~

Smiths (SMIN). General Industrials sector. I do not own.

Tech firm for Medical tech, Aerospace, Energy, General & Security.

Current price is 1,126. 52-high is 1778 and 52-Low is 790.

Market Cap of £4.86bn putting them 80th~ in the FTSE100

Dividends

Potential yield at current price is 3.76%
Dividend paid since 2000, 10 years of consecutive dividend growth. Growing at 2.6% per annum.
Div Cover is a 1.49

Financials:

I don't really know what I'm doing in this area. But lots of reading over the years has led me to focus on a couple of core things.
  1. Are Earnings Per Share (EPS) consistently growing? YOY EPS growth 5+ year
    1. Grown in 3 of the last 5 years. πŸ‘
  2. Are they paying out too much on dividends? Payout Ratio <60%
    1. 55% πŸ‘
  3. Is the ratio of share price to earnings sufficiently low enough? PE ratio <18
    1. 16.31 πŸ‘ 
  4. Is the Gross and Net Operating profit high enough? Gross 20%> Net 5%>
    1. πŸ‘Gross average is above 45%, Net above 15%
  5. Debt levels? Current Ratio >1 & Debt:Equity <1
    1. 2.94 and 0.64 respectively πŸ‘

Conclusion:

I like SMIN. The EPS over the last five years, whilst grown 3 out of the 5, does appear to be trending down which is a cause for concern. Low dividend growth over the previous 5 years too coupled with a lower starting yield.


~~~~~~~~~~~~~~~~~~~~~~~~

Decision

Tomorrow morning I will purchase MNDI as my 10th main company for my dividend portfolio.


This graph of historical EPS growth across the 3 companies particularly impressed me.


*Update*

  • 15 shares were purchased in MNDI for a total price of £208.41. 
  • Average cost per share of £13.89.
  • MNDI now make up 10% of my portfolio by holding value
  • And add £10.95 in potential annual dividends, taking the portfolio annual expected dividend over £100 to £102.95


Wednesday 25 March 2020

#108 Dividend Portfolio Updates

Aim is to have a portfolio of at least 15 companies, therefore reducing the weighting/risk on any individual company to below 10% of value of portfolio.

Therefore, given the size of my portfolio I will not be looking at topping up existing holdings, even though some prices look very tempting, but instead will add in 7 more holdings with the £1,400.

Let's rattle through what I've reviewed so far, and the shortlist...

First off, those big or often touted companies I am not currently going to invest in...

Why not? Average Payout Ratio Too High over last 5 years;
BAE Systems BA.
Vodafone VOD
Standard Life Aberdeen SLA
Centrica CNA
Imperal Brands IMB
Royal Dutsh Shell RDSB
BP BP.
GlaxoSmithKlein GSK

Why not? Broken Dividend Payments in previous years;
Persimmon PSN

So who am I considering..

Have looked into in detail and almost happy to proceed...
AHT - if yield is above 2.5%
JMAT
DCC
BATS - if I can get over investing in Tobacco and am happy with debt (current ratio)
HLMA - if yield is above 2.5% (unlikely)

Appear promising but haven't gone into enough detail...
BRBY
RMV - if yield is above 2.5% (unlikely)
SMIN
MGGT - if I am happy with EPS history
NXT
VCT
RB.
WPP
BT.A

Today I'll only focus on the one's I've looked into in detail, and so max I'll do is 5 investments out of the 7.

However, on todays prices both AHT (2.4%) and HLMA (0.89%) are below my minimum target yield of 2.5% and so the max is 3 out of 7 purchases.

BATS - yield of ~8.4%

High yield, great dividend history (20 years+ increasing dividends), low PE ratio, good Payout ratio, good EPS growth history, great operating margins... 2 fly's in the ointment 1) Tobacco is surely dying out and 2) current ratio debt is high.

However, I'm going to be a bit more risky than normal and proceed with this based on the fact that if it wasn't Tobacco this would be a sure-thing and I'll put faith in the size and scale of the business being able to adapt.

Purchased 8 shares for a cost (inc fees) price of £25.89 per share producing a yield on cost of 8.11% and adding £16.80 to my expected annual dividend, taking the total too £82.61.

DCC - yield of ~2.9%

Whilst it looks very good it is within the Support Services sector, of which I already own BNZL. I am not too precious about over-weighting this way, but I think it makes sense to spend more time reviewing this before proceeding.

No purchase.


JMAT - yield of ~4.5%

Operating in Chemicals sector. They break themselves down into 4 global areas; clean air, efficient natural resources, health and new markets.

Great dividend history (20 years+ increasing dividends), nice low payout ratio and PE, operating margins are lower than I'd like, but the have good dividend cover and low debt.

No real concerns about these guys, will purchase.

Purchased 11 shares for a cost (inc fees) price of £19.18 per share producing a yield on cost of 4.46% and adding £9.41 expected annual income to my portfolio, taking the total to £92.01.


Not far from £100 expected annual income. However, we'll see how Covid-19 decimates the dividends. Have to remember I am investing for the long game.


Getting closer to the 15> portfolio and have made great strides in March.


#107 Bonus Usage

The world is going through an immense battle with Covid and everywhere it is all I can see or hear. I fear for a lot of things, but truly believe we can come out of this better.

To distract myself - and I realise how fortunate we are to be considering this - I am reviewing my options for what to do with the annual bonus.

Luckily, I am right at the outset of my investing journey and so this is probably an opportunity to invest at a comparative bottom of the markets.

Tomorrow I will receive my bonus of £8,666.

£1k of that will be given to the wife for her to do with as she pleases.

£5k of that will be added to our emergency fund. Coupled with the £4.7k that was put aside for our summer holiday - no longer going to happen - that will take us to £14.7k cash in our emergency fund. Coupled with the fact that I've got a 3 month notice period which would be tax free.. any concerns about redundancy following the economic affects of all of this should be minimal now. Very lucky.

So what to do with the remaining £2,666....

My initial thought was to plow it all into my dividend portfolio. However, I do thoroughly believe that over time global index funds will be the best place for my long term investments. So I want to stick to at least 50% of my equity investments in that.

Currently I have a dividend portfolio worth £1,200~. It is entirely likely or possible I will not be in a position to add in any further cash over the next 12 months.

My Global Index fund currently has 0 invested, but a monthly direct debit of £200, with the 1st installment coming in April. Therefore in 12 months I expect to have invested £2,400.

So currently I am over-weight on my dividend portfolio, but expect to have twice as much within the Global Fund in 12 months time.

Maybe it's best to just split it in 2. £1,300 for the dividend portfolio and £1,300 to be drip fed into Global fund.

With my current approach of investing £200 per position in the Dividend portfolio, this would allow me to buy into 6 more companies, 7 if I took £1,400. That would take me 14 companies which is roughly what I am looking to get too (between 15-20) to spread the risk.

So £1,400 into dividend portfolio... and £1,200 into the Global Fund it is then....

I'll drip the £1,200 Global Fund money in 6 £200 installments every month, sandwiched between my current direct debit.

Now to decide on where and when to put that £1,400...


Wednesday 11 March 2020

#106 New Company; ULVR

Shopping spree continues. I have £400 left from my unexpected expenses. This feels like I'm just splashing the cash on fun items, but it's certainly better to invest it this way rather than spending on headphones (my other idea) !

I quickly scanned 20~ companies and decided to do a deep-dive on Unilever, ULVR.

Info:
A stock I don't own in a sector (personal goods) I do not own.

It's brands include Dove, Magnum, Lipton, Hellmans.

The largest company on the FTSE100 by Market Cap. About 1/10 the size of Apple.

Sounds like a very defensive company and quarterly dividends sounds aligned to that.

Share price 52-week high is £53.33 per share. 52-Low is recent £40.21. Currently available just under £41.27.

Dividend Record: 

Over 20 years of consecutive dividend growth. Growing at over 5% per annum. Whist the Div Cover dropped below my threshold last year, it was above for the previous four.

Financials:

I don't really know what I'm doing in this area. But lots of reading over the years has led me to focus on a couple of core things.

  1. Are Earnings Per Share (EPS) consistently growing? YOY EPS growth 5+ year
    1. Grown in 4 of the last 5 years.
  2. Are they paying out too much on dividends? Payout Ratio <60%
    1. Was lowest in 2019 than for a long time, has in most prevoius years been jsut above 60%, which I wouldn't like. However, it does seem this is fairly normal for a defensive stock.
  3. Is the ratio of share price to earnings sufficiently low enough? PE ratio <18
    1. On the money, would prefer them to be cheaper, but 18.24 is within acceptable bounds. 
  4. Is the Gross and Net Operating profit high enough? Gross 20%> Net 5%>
    1. ✅Gross average is above 40%, Net above 16%

Conclusion:

The scale of the company and the position they are in, coupled with the consistency of their dividend track record makes me feel this one is a fairly low risk decision to BUY.

~~~~~~~~~~~~~~~~~~~~~

So ULVR were added to my portfolio, bringing the total up to 5 decent companies.

5 shares were added for a cost including fees of £212.48, an average price per share of £42.50. A yield of 3.84%

This adds £8.15 expected annual dividends to my portfolio, taking the total annual expected dividends too £42.44.

ULVR now represent 20% of my portfolio based on Value and 19% based on income.

I'll receive dividends on a quarterly basis, starting in June.


FYI
I use this website for financial date review; http://financials.morningstar.com/ratios/r.html?t=xlon:ulvr
And this one for the historical dividend date review:  https://www.dividenddata.co.uk/dividend-history.py?epic=ULVR


Tuesday 10 March 2020

#105 2 Additions to the Portfolio

Following my recent review and recommended BUY for BWY, BNZL and DGE and my subsequent purchase of BWY. I decided to put more money into my portfolio.

I have convinced myself that this is because the sooner I get my portfolio up to 10+ companies I'll have lowered the risk because it will reduce the weighting of any one company to circa ~10%~

In reality this is probably because a) I'm excited by increasing the size of my portfolio and b) because I had an extra £1k come to me from old work expenses which I had completely forgotten about :)

So I invested in the remaining two companies that I had decided I would BUY; BNZL and DGE.

Currently, based on the amount of available cash I have and expect to have going forward I'm starting with intitial purchases of £200~ per company.

Here's the data behind the deals and update to my portfolio.

I completed these two purchases on Monday 9th March - ie the day that the markets crashed due to the oil price and continued coronovirus.

BNZL 

Purchased 12 shares for £218.15 including fees. This averages out at a cost of £18.18 per share.

Pretty happy with this price. Their 52-week high is £25 and 52-week low is £17.48.

This adds £6.16 expected annual dividend to my portfolio. It'll be nice when these numbers are more significant. I have to accept I am at the very beginning of a long journey.

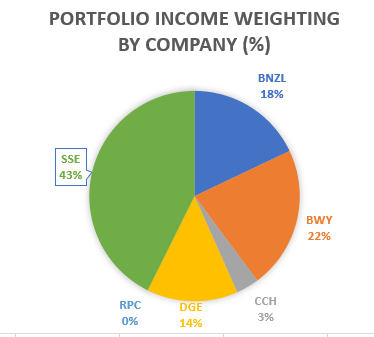
That expected £6.16 annual dividend equates to 18% of my expected portfolio annual income.

At the cost price and expected annual dividend this purchase provides a yield of 2.82%

I will first benefit from a dividend in July this year.

DGE

Purchased 7 shares for £189.18 including fees. This is an average cost of £27.03 per share.

Again this is far closer to the 52-week low (£25.69) than it is the 52-week high (£36.33) so happy with price.

 This adds £4.80 to my expected annual returns. Which equates to a 14% weighting within my portfolio expected annual returns.

At the cost price and expected annual dividend this purchase was at a yield of 2.54%

The first dividend I'll receive will be in October this year. Sadly I missed the ex-div for their April payment by a matter of weeks.


Overall Portfolio

I have now invested £1,035 in purchasing shares.

My RPC shares were sold for £190.32, crystallizing an £8.75 loss exc received dividends. This was because the company was taken over, disappointing but I'm sure I'll have bigger lows to come on this journey.

The remaining 41 shares I own are currently valued at £842.50. This is -£2.18 than I purchased them for.

My total expected annual dividend is £34.29. This equates to a yield on the portfolio purchase price of 3.31%


Thursday 5 March 2020

#104 March Dividend Portfolio Decision

Exciting times. I'm buying shares again!!

Last time out I reviewed BNZL, DGE and BWY.

All three ticked the box and were recommended to buy.

BNZL wins the dividend history.
BWY wins the best recent increases in EPS.
Dividend cover and payout ratios are all positive and drawn.
BWY wins with the lowest (almost half) for the Price to Earnings ratio.
DGE trumps the others with significantly the largest operation margins.

They all have HL Broker consensus of Buy.

In the end I'll probably purchase all three fairly soon. So it's a case of if the underlying businesses are buy-able, which one offers the best return now.

According to my spreadsheet, based on current yield and average dividend growth in the last 5 years BWY offers significantly higher returns over the next 10 years.

I have a slight concern that their market is UK property whereas the other two are global and more diversified. But that really isn't part of my screening and shouldn't cloud my judgement.

So BWY were purchased. 

I purchased 5 shares at a total cost, inclusive of charges, for £190.91. Working out at an average per share cost of £38.38.

This takes my forecast annual dividend payments from £15.83 up to £23.33.